
Islington Woods market
Explore housing trends, compare markets and get clear insights to help you buy, sell or invest with confidence.
Market at a glance
The latest figures for Islington Woods — September 2026.
In September 2026, 6 homes sold in Islington Woods at a median price of $1,810,000, 7.1% higher than in September 2025. Homes took 47 days to sell on average and sold for 95.9% of the asking price.
Median sold price: the middle sale of the month, by firm date. Days on market: the average for homes that sold. Sold vs asking: the average sold price as a share of the final asking price. Year-ago comparisons use the same area and home type.
Quick market lookups
Get instant insights on the topics that matter to you.
Market trends
See how prices, sales, new listings and inventory have changed over time.
Median sold price · all homes
Monthly, by firm date, Sep 2024 – Sep 2026.
Seasonal patterns
How a typical year runs in York Region, from 2013–2025 sales. A history, not a forecast.
Bars: the average share of a year's sales that happened in each month. Under each month: how its median sold price sat against that year's own trend (the median over 13 years) — partly the season, partly which homes sell then. In a typical year September has 8.3% of the year's sales. Pattern shown for York Region.
Property types at a glance
Compare key metrics by home type — September 2026.
Market pace
Key indicators of market activity: what's coming on, what's available and how fast it's selling.
Buy vs rent
Estimated monthly cost to own at Islington Woods's median sold price, next to what homes are listed for rent at today.
Assumptions: 20% down, 4.99% for 25 years compounded semi-annually (as Canadian mortgages are), property tax at 0.9% of the price a year, home insurance about $100 a month; no condo fee. Rents are asking rents of whole homes listed for lease today, not signed leases; a bedroom count with fewer than 10 listings isn't shown. An estimate to compare the market, not advice for your situation.
Compare areas
See how different regions performed in September 2026: median sold price and change from a year earlier.
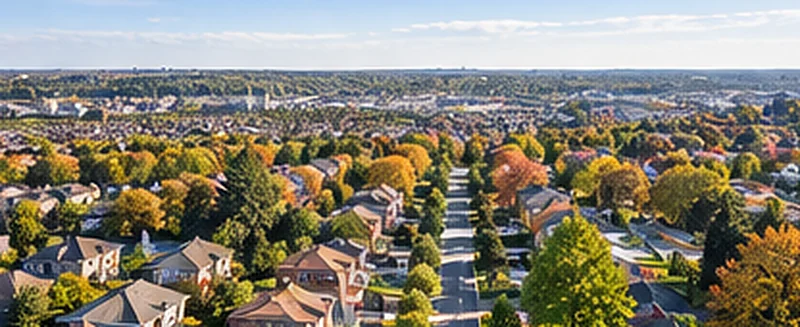 Greater Toronto Area$870,000
 Durham Region$780,000
 York Region$1,040,000
 Peel Region$850,000
 Halton Region$980,000
 City of Toronto$820,000
Every area uses the same measure: median sold price of all homes, by firm date, for September 2026. Pictures are illustrations.
Compare any areas
Median sold price
Homes sold
Days on market
Sold vs asking
Benchmark price (TRREB HPI)
Homes for sale now
Each area's newest finished month, all homes, by firm date; the benchmark is TRREB's latest; homes for sale are today's count. A figure with too few sales to publish says so.
Islington Woods at a glance
How the market leans here, and who has been buying.
Homes in Islington Woods are taking around 36 days to sell, and going for about 97.3% of asking. There is usually room to negotiate.
What sold in Islington Woods, by home type — September 2026
Every style of home, averaged honestly — so you can see exactly where your home fits.
Average sold price within each tier. Detached split by style; townhomes by freehold or condo and 2- or 3-storey; semis and links counted separately. Tiers with fewer than 3 sales are marked indicative. Ask us for a precise read on any segment.
Detached homes sold — by size
Median price and price-per-square-foot for detached homes across size bands in September 2026. Smaller homes cost more per foot; larger homes cost more overall.
| SIZE (SQ FT) | MEDIAN SOLD | HOMES SOLD | $ / SQ FT |
|---|---|---|---|
| Under 1,000 | — | 1 | — |
| 1,000 - 1,499 | — | 1 | — |
| 2,500 - 2,999 | — | 2 | — |
| 3,500+ | — | 2 | — |
Bands with only a handful of sales are directional. Ask us for the fuller multi-month trend.
Recent sold homes — September 2026
Individual sold listings across Islington Woods — free once you create an account.
| Address | Community | Type | Bed / Bath | List | Sold | Sold on |
|---|---|---|---|---|---|---|
Create a free account and agree to the VOW terms to unlock individual sold prices and closed-listing details across Islington Woods. Takes a minute.
What moves Islington Woods prices
Two forces sit behind almost every price move: the cost of borrowing and the pace of inflation. When rates fall and inflation cools, buying power rises and prices tend to firm; when they climb, the market cools.
Monthly market data
Homes sold, median price, days on market and sold vs asking in Islington Woods, for the last 36 months.
Show the table
| Month | Homes sold | Median price | Days on market | Sold vs asking |
|---|---|---|---|---|
| Oct 2026 (so far) | 6 | $2,020,000 | 36 | 99.1% |
| Sep 2026 | 6 | $1,810,000 | 47 | 95.9% |
| Aug 2026 | 5 | $2,230,000 | 22 | 96.9% |
| Jul 2026 | 4 | — | 32 | 97.1% |
| Jun 2026 | 6 | $1,830,000 | 20 | 98.0% |
| May 2026 | 7 | $1,630,000 | 20 | 96.3% |
| Apr 2026 | 8 | $1,900,000 | 23 | 98.7% |
| Mar 2026 | 4 | — | 16 | 96.6% |
| Feb 2026 | 3 | — | 18 | 95.7% |
| Jan 2026 | 1 | — | 30 | 97.1% |
| Dec 2025 | 8 | $1,100,000 | 56 | 95.3% |
| Nov 2025 | 2 | — | 18 | 97.9% |
| Oct 2025 | 5 | $1,760,000 | 24 | 94.2% |
| Sep 2025 | 8 | $1,690,000 | 36 | 95.3% |
| Aug 2025 | 7 | $2,000,000 | 30 | 94.9% |
| Jul 2025 | 1 | — | 25 | 98.1% |
| Jun 2025 | 6 | $760,000 | 40 | 95.0% |
| May 2025 | 4 | — | 8 | 97.5% |
| Apr 2025 | 5 | $1,850,000 | 39 | 95.6% |
| Mar 2025 | 4 | — | 41 | 100.2% |
| Feb 2025 | 6 | $1,820,000 | 36 | 95.0% |
| Jan 2025 | 2 | — | 42 | 91.3% |
| Dec 2024 | 4 | — | 14 | 96.4% |
| Nov 2024 | 7 | $1,480,000 | 24 | 96.5% |
| Oct 2024 | 5 | $1,630,000 | 24 | 97.5% |
| Sep 2024 | 7 | $1,250,000 | 22 | 103.9% |
| Aug 2024 | 2 | — | 14 | 95.9% |
| Jul 2024 | 2 | — | 17 | 97.0% |
| Jun 2024 | 6 | $2,040,000 | 28 | 95.7% |
| May 2024 | 9 | $1,900,000 | 17 | 97.6% |
| Apr 2024 | 5 | $1,260,000 | 31 | 96.0% |
| Mar 2024 | 9 | $2,000,000 | 33 | 98.2% |
| Feb 2024 | 7 | $1,330,000 | 28 | 98.9% |
| Jan 2024 | 5 | $550,000 | 28 | 98.6% |
| Dec 2023 | 1 | — | 75 | 95.5% |
| Nov 2023 | 3 | — | 20 | 93.0% |
By firm date. A dash: too few sales that month to publish the figure.
Latest market insights
Analysis, trends and what the numbers mean for buyers and sellers.
 Economy & RatesInflation rose to 3.1% in September: what it means for mortgage rates and GTA homesOctober 20, 2026
 For BuyersUsing your RRSP for a down payment: the Home Buyers' Plan in 2026, with the mathOctober 15, 2026
 Market WatchYork Region Market Snapshot, September 2026 — the biggest price reset of the big five, and Markham's quick salesOctober 7, 2026